Holiday Shopping Behavior All Ecommerce Owners Should Know
Gone are the days of holiday shoppers patiently waiting for the stroke of midnight on Black Friday and Cyber Monday to begin scouring for holiday deals. Retailers, specifically ecommerce, have undoubtedly caught on to the record spending levels of the holiday season and have turned two days into an entire weekend of sales to capitalize on the busiest time of the year. Let’s break down the data!
About the Ecommerce Data
- 731 stores in US and Canada, 418 Non-US/CA
- All small-medium ecommerce businesses that have at least 3 years of historical data for comparison
- Averaging ~30 orders/day on a normal day
- Average store had approximately $1m revenue in 2016
Hourly Order Volume – Non-US/Canada
As you can see, right before Black Friday officially hits there’s a considerable dip in order volume. As per usual, order volume spikes right as the clock strikes midnight and then drops significantly. The order volume ramps up again around lunch time and then drops off in the evening where it remains for the rest of the weekend and even Cyber Monday. It appears that outside of the US and Canada Cyber Monday hasn’t become the phenomenon we experience.
In comparison to years past, you can see the overall hourly order volume has drastically increased since 2014. Additionally, it appears that people are pre-planning what they want to purchase or where from. There are spikes right as Black Friday hits, again at lunch time and then finally in the evening before tapering off and ultimately completely dropping off just before midnight.
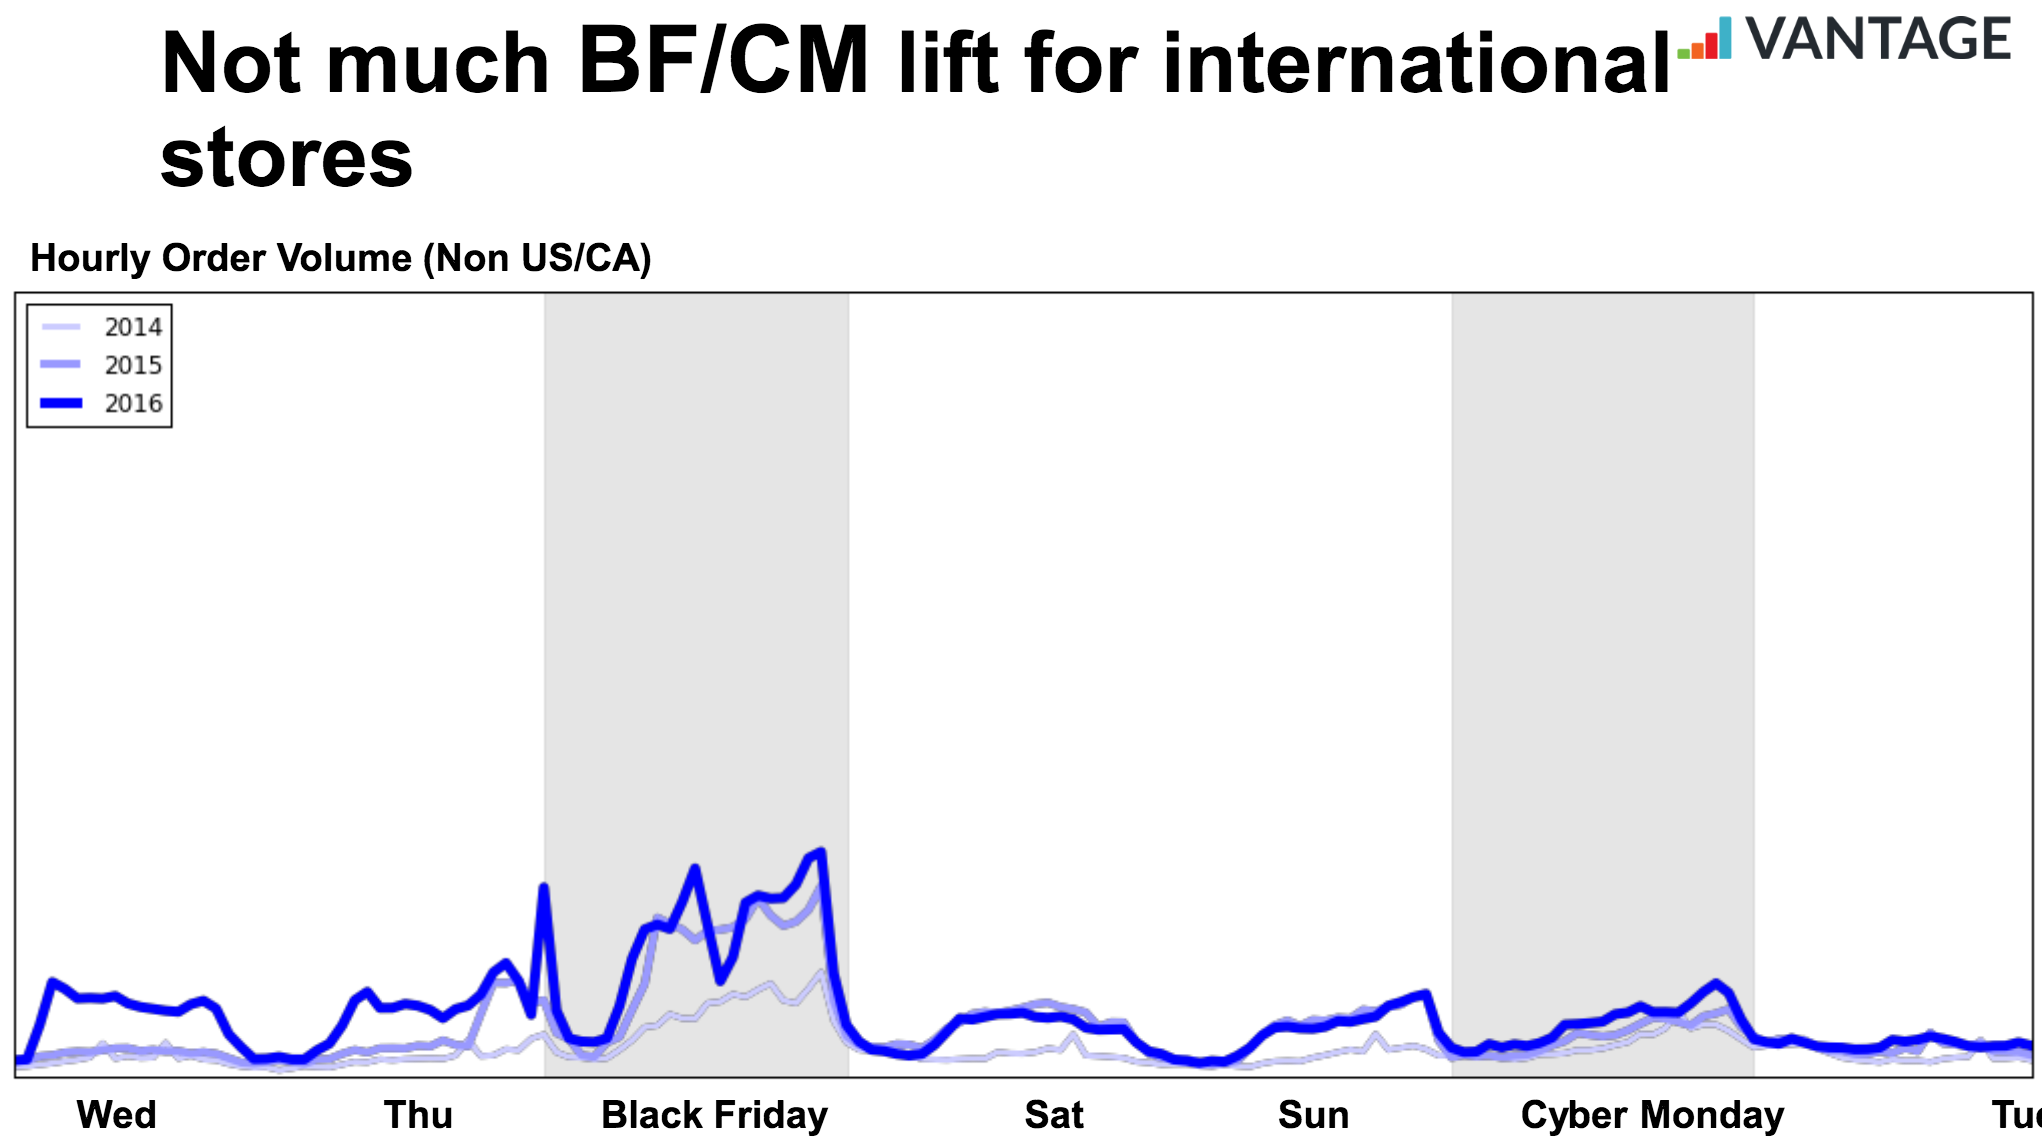

What You’re Looking at:
The graph pictured shows the hourly number of orders for all stores
418 stores based outside of the US/CA that have data for the past 3 years
Bands are Black Friday/Cyber Monday in GMT
Hourly Order Volume – US and Canada
This graph in comparison to non-US and Canadian countries showcases how different our shopping patterns truly are. Though we initially see a spike right at midnight on Black Friday as per usual, there’s an even more significant jump around lunch time that continues right up until midnight. People aren’t waiting with bated breath for the clock to strike midnight anymore, they’re taking their time.
Unlike countries outside the US and Canada, order volume remains high throughout Saturday and Sunday, substantially more than 2015 and especially 2014. Perhaps the most interesting point is the incredible swell in orders on Cyber Monday, most notably right before midnight. As you can see, the highest point in order volume on Cyber Monday well surpasses the peak on Black Friday. The key takeaway here is that people are taking their time, they’re not rushing to stores to be trampled and prodded. They’re taking their time from the comfort of their home or desk chair and pre-planning what they’re going to purchase before they pull the trigger.
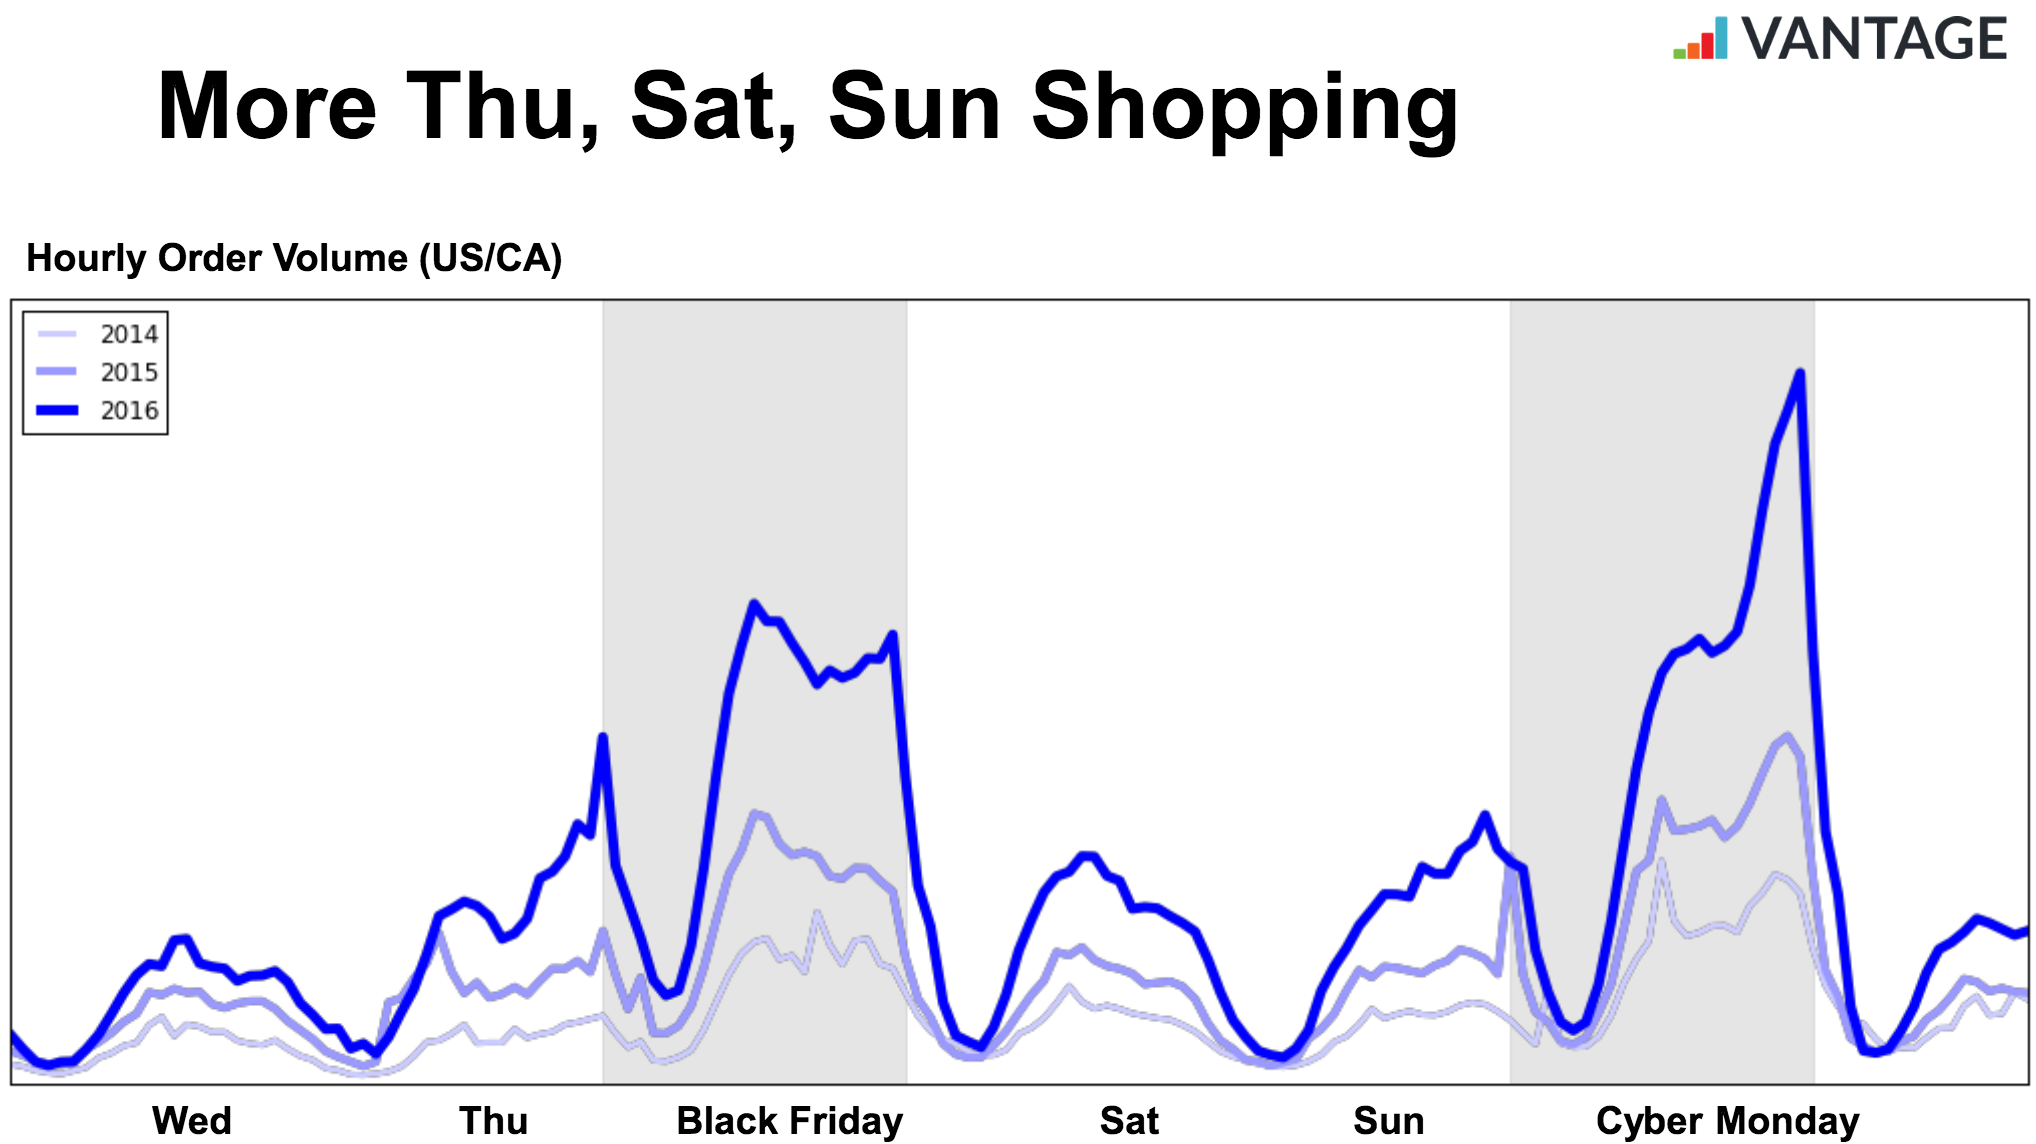

What You’re Looking at:
Graph shows hourly # of orders for all stores
731 stores based in US/CA that have data for all 3 years
Bands are Black Friday/Cyber Monday in EST
Black Friday + Cyber Monday Increase in Order Volume
- 2016: 5.4 times baseline (baseline up 70% YoY, Black Friday/Cyber Monday up 80% YoY)
- 2015: 5.1 times baseline (baseline up 44% YoY, Black Friday/Cyber Monday up 69% YoY)
- 2014: 4.3 times baseline
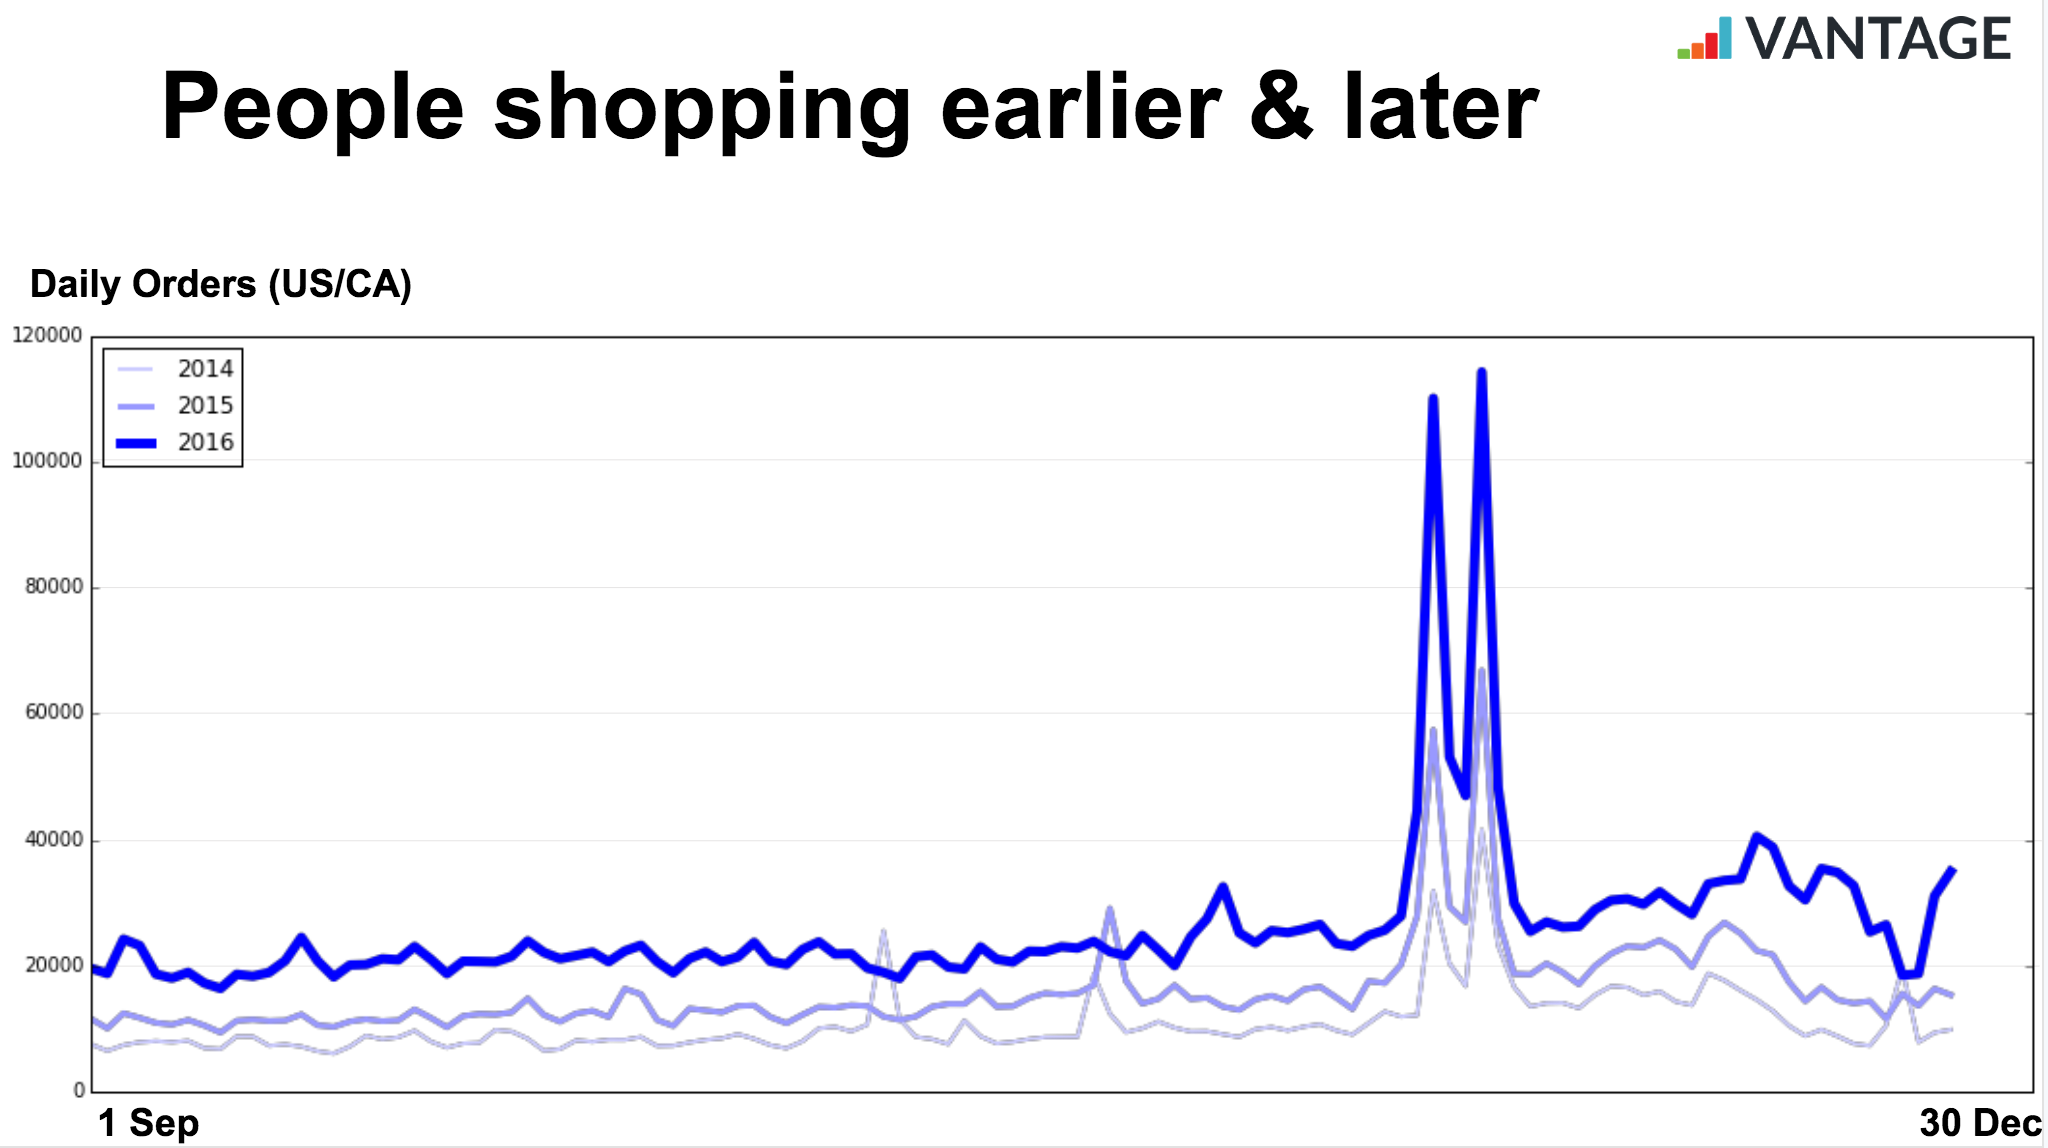
Daily Order Volume
While we see a steady increase from 2014 to 2015 there’s a giant increase from 2015 to 2016 regarding daily order volume. 2015 peaked at around 70,000, whereas we can see that 2016 peaked at a whopping 150,000!


What You’re Looking at:
Same 731 stores except now we’re looking at daily orders
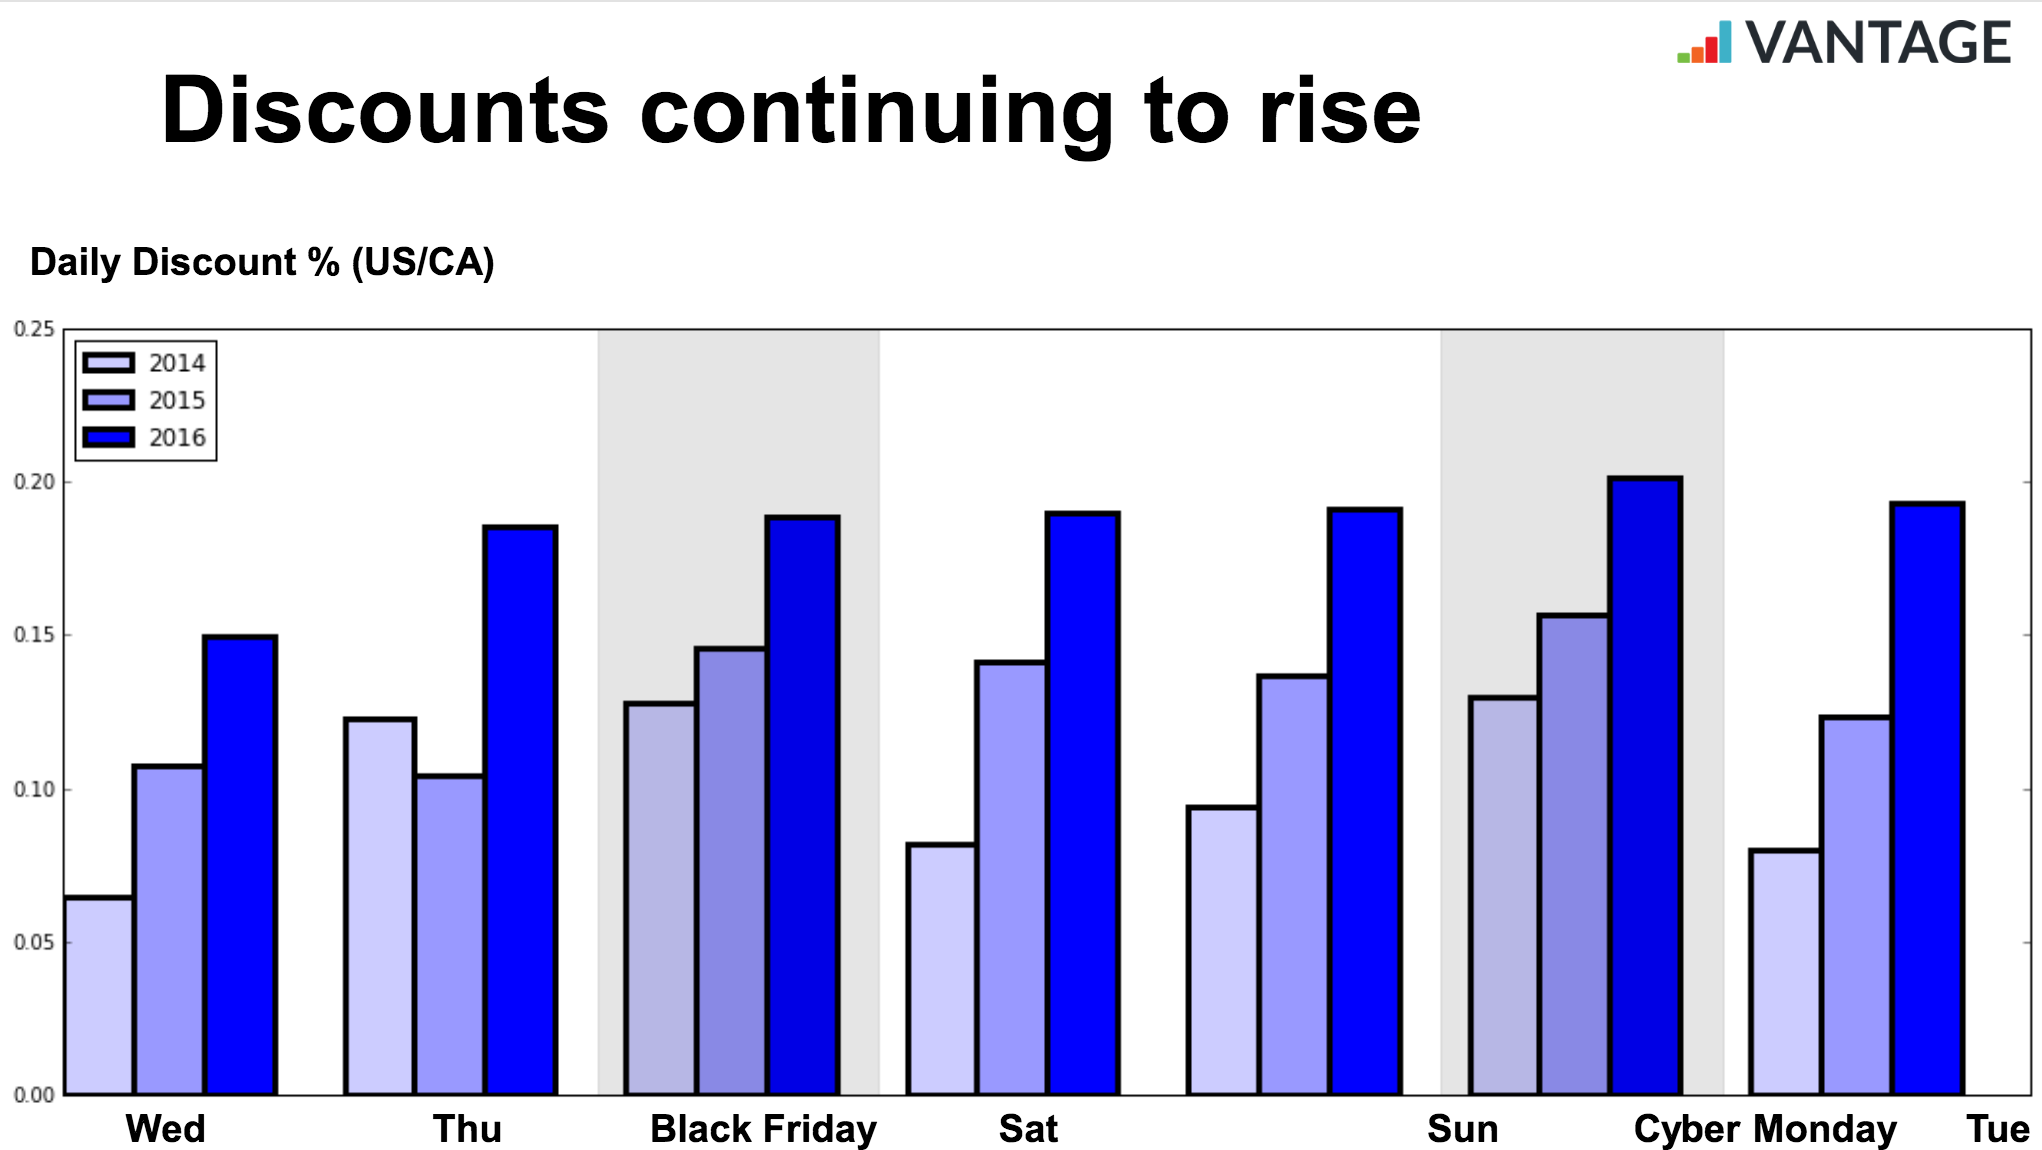
Daily Discount Percentage
It’s clear that from 2014-2016 the discounts offered on Black Friday and Cyber Monday are continually increasing. Perhaps the most interesting aspect of the data is noting that retailers appear to have started offering bigger discounts earlier this year – as much as 15%! In previous years during this time period, we saw discounts sticking in the range of 5-7% discounted. 2016 also saw a new peak in daily discount percentage settling at an astounding 20%.

Key Takeaways –
Are Black Friday and Cyber Monday Important for your Ecommerce Business?
When asked initially about your impression of Black Friday and cyber Monday, you might be inclined to suggest shoppers are just looking for deals, only interested in making small purchases, and won’t make good long-term customers. On the contrary, Black Friday is a fantastic time to attract valuable, new customers. 2016 had one of the biggest holiday shopping seasons ever online. Though a surge in spending was seen across Black Friday and Cyber Monday, the spending definitely didn’t stop there. The data suggests that Black Friday is no longer a single day, but rather a multi-day event that seems to have swept both Thanksgiving and Cyber Monday deals up under its name. It might surprise you to know that spending increased on Thanksgiving Day and continued until 11:59 pm Cyber Monday.
Everything about 2016’s Black Friday / Cyber Monday sales were bigger and more aggressive than 2015. Previous years saw a clear lift in spending on Black Friday and Cyber Monday, but now there has been a clear shift from a day of deals to a weekend long event. That means shoppers are no longer feeling the same sense of urgency to stay up late to score the sales.
Another key trend to note is the massive increase in discounts being offered by retailers. In 2015 discounts were only seen on Black Friday and Cyber Monday with an average discount of 14%. But in 2016, discounts were deeper, earlier, and spanned over a longer period, staying over 18% for a total of 5 days in a row from Thursday through Monday. While it’s clear that both retailers and shoppers have bought into the Black Friday experience, the days outside of Thanksgiving Day to Cyber Monday remain unchanged even though there were many Pre-Black Friday sales this year. Retailers have been trying to get shoppers to start earlier with zero results for their efforts except for lost margins. We saw this again this year, with very little Pre-Black Friday shopping. This is important for retailers to keep in mind rolling into next year; maintaining a sense of urgency with a start and end date will help you more than harm you.

What’s Changed in 2016

- The discounts were bigger
- The discounts started earlier
- An increase in people and order sizes on Saturday and Sunday
- Significant shrinkage in the gap between Black Friday and Cyber Monday
- People started shopping earlier
What Didn’t Change in 2016
- Hourly patterns of how people shop from Black Friday to Cyber Monday
- Average order size
- International stores still not seeing a big lift
Predictions for 2017
- Start sales ahead of Black Friday (if you have the volume to justify it)
- Keep selling and offering expedited shipping as close to Christmas as you can
- Start telling people early about your sales, get your campaigns scheduled early

*** Data used in this analysis comes from looking at over 1,000 stores that use Vantage. Data used for growth year-over-year order growth for US-based stores selling in USD that were in operation before 1 Oct 2015 and are still in operation today.

Get ecommerce insights, tips, and tricks delivered straight to your inbox!
By submitting your email above, you provide us consent to email you educational content, and information on our products and services. You may unsubscribe at any time.
