Unlock a Clear View of Your Category With Share of Voice

Advertisers can easily measure how their campaigns perform in isolation. What’s harder is understanding how that performance compares to the rest of the category. Share of Voice fills that gap by showing share of spend, impressions, and clicks so you always know whether you are leading, lagging, or losing ground.
For both retailers and their supplier partners, this context is critical. Retailers need to understand how brands are competing within their network, while suppliers need a clear view of their relative position to make confident investment decisions.
“A Share of Voice dashboard is essential to keeping your RMN competitive,” explains Jinhan Ahn, Product Manager at Vantage, formerly of BCG. “Most leading RMNs provide this view so brands can clearly quantify the value they’re capturing relative to competitors, building investment confidence beyond what baseline campaign KPIs like ROAS can convey.”
The Share of Voice dashboard in the Vantage Insight Console brings this visibility into a single, intuitive view.
Know your position. Spot your opportunity.
The dashboard is designed to make competitive insight easy to follow and even easier to use for retailers and suppliers alike. It includes:
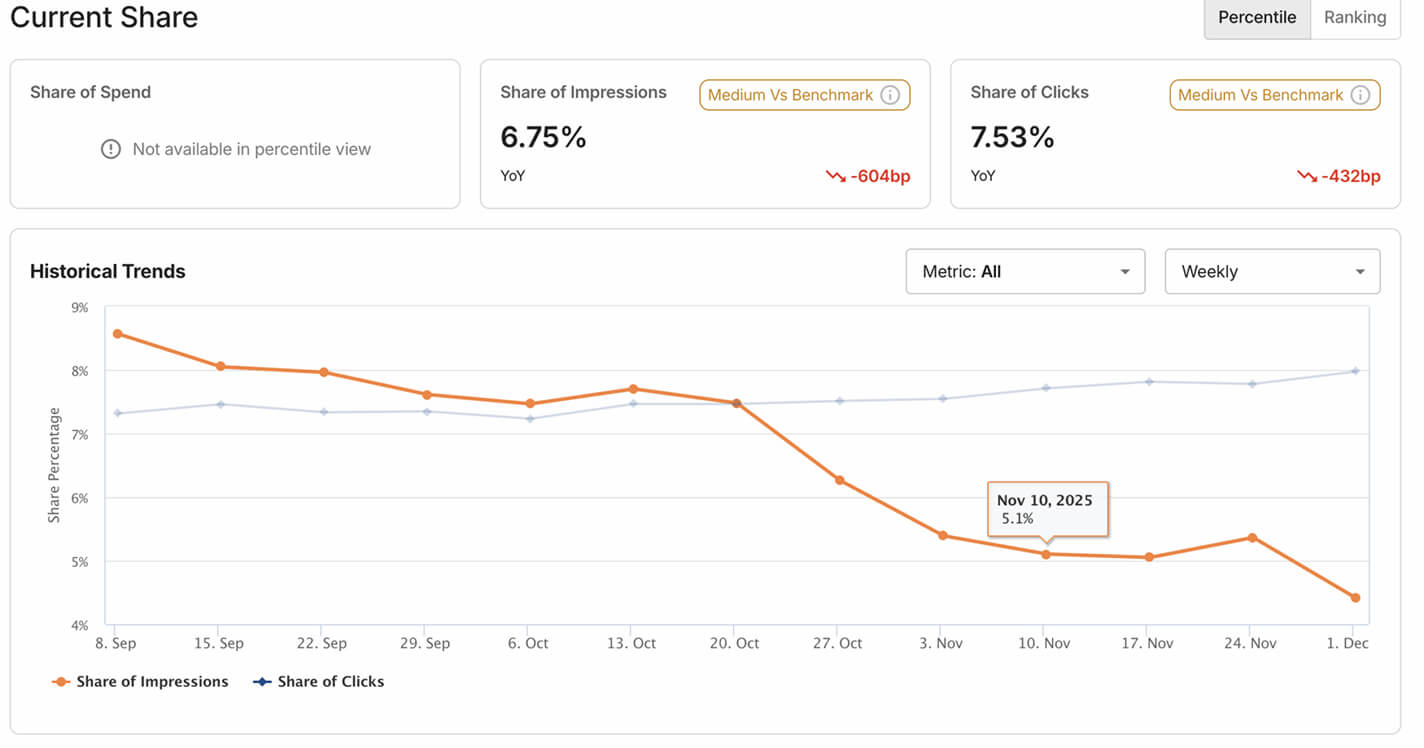
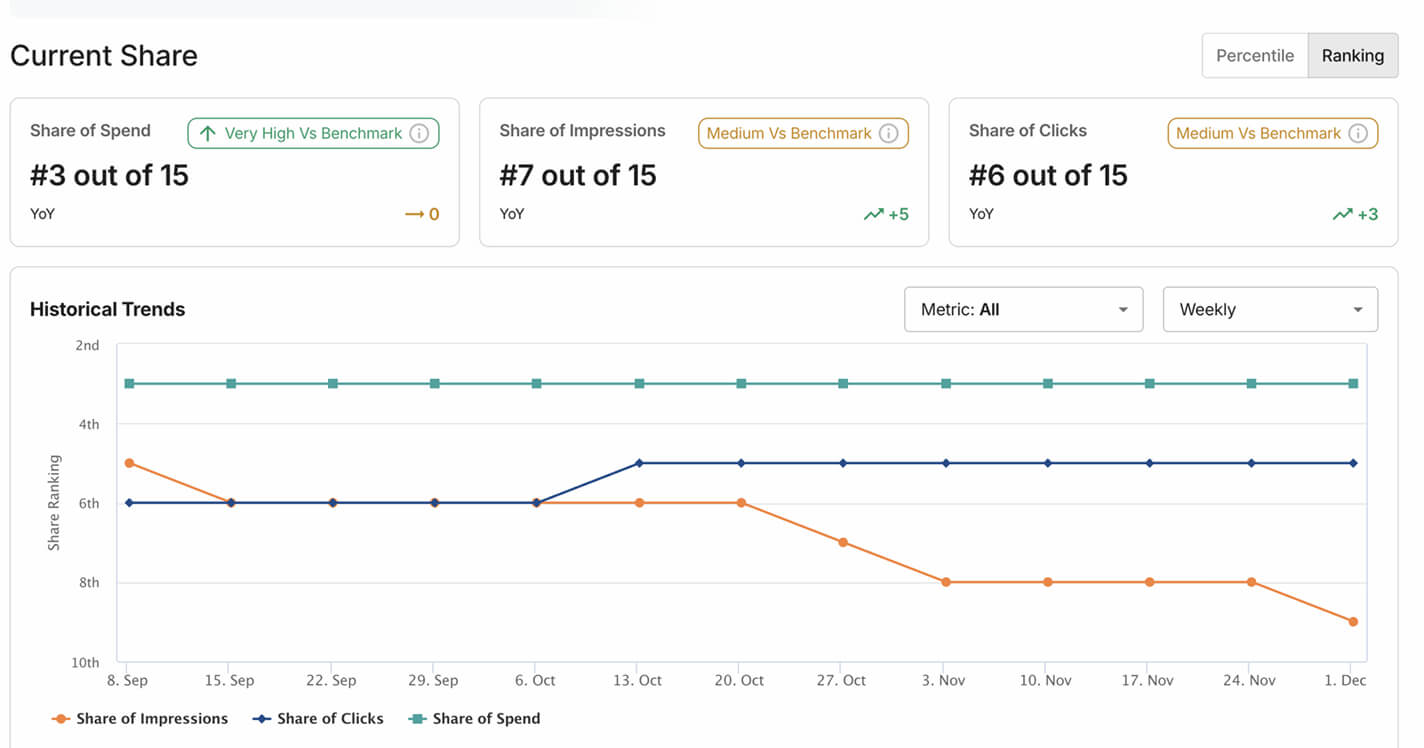
- Share of Spend, Impressions, and Clicks
- Trendlines that show how each metric shifts over time
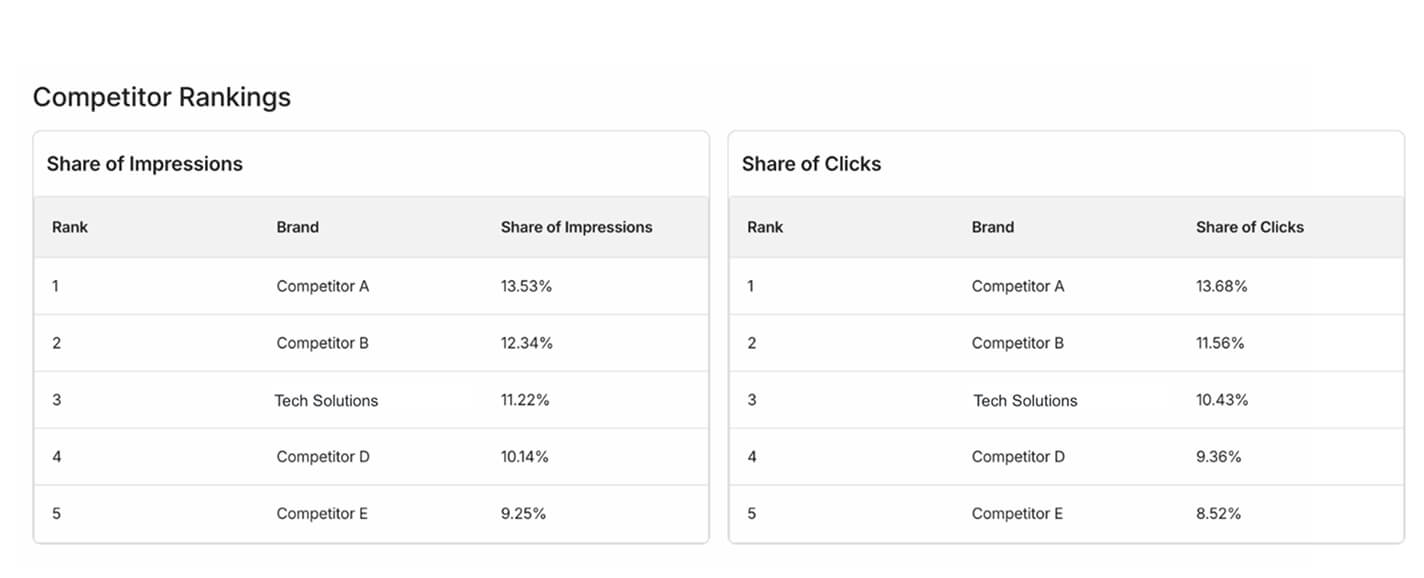
- A competitor ranking view that shows your position in the category, paired with an anonymized top five brand share comparison to highlight where you have room to grow against leading brands
- Snapshot cards that surface increases and decreases at a glance, including comparisons against benchmarks
All data refreshes automatically and stays consistent across retailers, suppliers, and internal teams.
Built for fast, interactive exploration
When you open the dashboard, the experience is immediate and responsive. Filter by category, ad type, or timeframe, and the entire view updates in real time.
- Switching departments recalibrates your trendlines
- Changing ad types updates your ranking within that format
- Adjusting the date range reveals how your share evolves week to week
Everything moves together, removing the need for spreadsheets or manual reports while keeping all stakeholders aligned.
Turning insight into your next move
Share of Voice becomes most valuable when it guides action.
If Share of Clicks begins to decline, snapshot cards flag the shift, and the ranking view shows how position is changing within the anonymized competitive set. From there, retailers and suppliers can isolate the department or ad type driving the change and determine whether increased investment or a strategic shift could improve results.
For suppliers, this means pinpointing where they are losing ground and where incremental spend could have the greatest impact. For retailers, it enables more informed conversations with brand partners and helps drive stronger, more confident investment across the network.
With share data, rankings, and trends in one place, it becomes easier to understand what is happening and what to do next.
With share data, rankings, and trends in one place, it becomes easier to understand what is happening and what to do next.
Why is this view different?
The Share of Voice dashboard replaces manual deck building and outdated reporting with:
- Always-current, automated data
- Shared visibility across retailers and suppliers
- A self-serve, centralized source of truth
- A scalable architecture ready for new retailers and expanded insight
This is competitive intelligence built for day-to-day decision making.
Explore your share today
Contact Vantage to learn more about how you can turn competitive insight into confident, data-driven actions.
Abby Borden

Abby Borden is Vice President of Marketing at Vantage, where she leads marketing and defines how the company positions, communicates, and wins in retail media. Over the past decade, she has built her career turning complex technology into clear, differentiated narratives that shape markets and drive revenue.
Abby’s philosophy: the best marketing is rarely the flashiest. It’s disciplined, grounded, and built on the kind of foundational work that makes bold creative possible.
You may also like


Subscribe to Vantage Point Newsletter

